
🏠 November 2025 Reno–Sparks Real Estate Market Update
Prices Hold, Inventory Tightens, and Sellers Feel the Pressure
The Reno–Sparks housing market is shifting beneath the surface.
Prices are steady but not rising, inventory is ticking up, and more sellers are adjusting than we’ve seen in years.
The data tells a story you won’t read in the headlines — one that could change how you think about your next move.
November 2025 Reno Sparks Real Estate Market Update Show.
📉 Mortgage Rates Ease Slightly

Mortgage rates have been moving in a narrow band for nearly two years, and October closed at 6.3%, down 2.8% from 6.4% last year.
Nearly 80 percent of buyers finance their homes, so small shifts in rates make a big difference.
Rates have stabilized in the low 6s to low 7s, and that pattern is expected to continue into 2026 — offering some predictability, but not much affordability relief.
💵 Median Sales Price — Flat but Firm
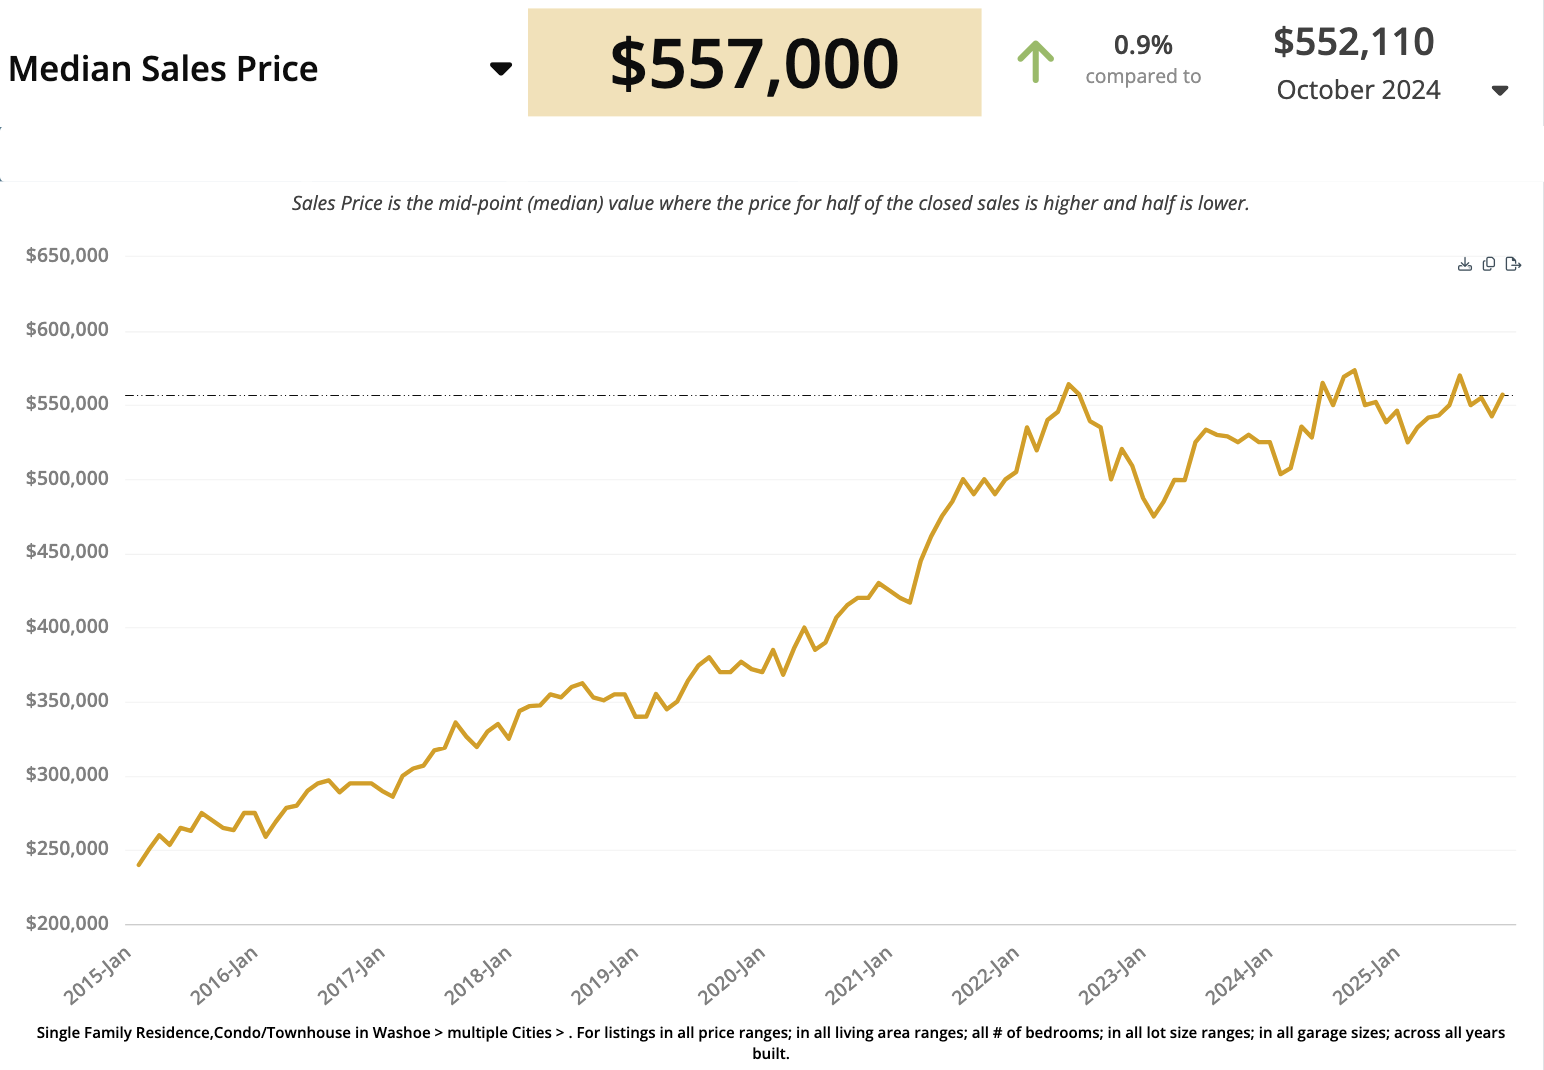
The median home price across Reno–Sparks stands at $557,000, up just 0.9% from $552,110 last October.
Prices have remained in a tight range around $550K for nearly three years — neither surging nor collapsing.
When adjusted for inflation and mortgage rates, the market looks stable but stretched for affordability.
💡 Affordability Index — Stuck Around 55 Percent
With rates above 6 percent and prices near $550K, the affordability index is roughly 55 percent — meaning the typical household can afford just over half the cost of a median-priced home.
That keeps many would-be buyers sidelined and reinforces the “steady but slow” tone of the market.
🏡 New Listings — Down 12.3 Percent

Homeowners are thinking twice about listing. Only 526 new listings came on the market in October, down 12.3 percent from 600 last year.
Most new activity sits between $400K and $750K, where the bulk of Reno–Sparks’ demand remains.
Higher-end price brackets continue to see fewer fresh listings — and slower turnover.
📊 Active Inventory — 1,307 Homes (-6 Percent YoY)

Total active listings dropped slightly to 1,307, down 6 percent from 1,390 a year ago.
But the mix of what’s available is telling:
Most listings cluster between $400K and $750K.
The $1 million-plus segment has a growing oversupply — hundreds of homes competing for a handful of buyers.
That imbalance puts downward pressure on the upper-end market while mid-range homes stay competitive.
🏁 Closed Sales — Barely Up, Still Muted

Sales volume remains soft but stable.
There were 494 closed sales in October, a 0.4 percent increase from 492 the year before.
Activity is healthy in the mid-price ranges ($400K–$700K) but drops sharply above $750K, where supply far exceeds demand.
As that gap widens, luxury sellers will need sharper pricing and patience.
🕐 Months of Supply — 2.6 and Rising
Standing inventory sits at 2.6 months, a balanced-to-leaning-buyer market.
If supply keeps climbing, we could see slower momentum heading into 2026.
Upper-tier segments are already showing four to five months of supply — a clear sign of softness at the top.
🚫 Unsold Listings — Up 18.5 Percent
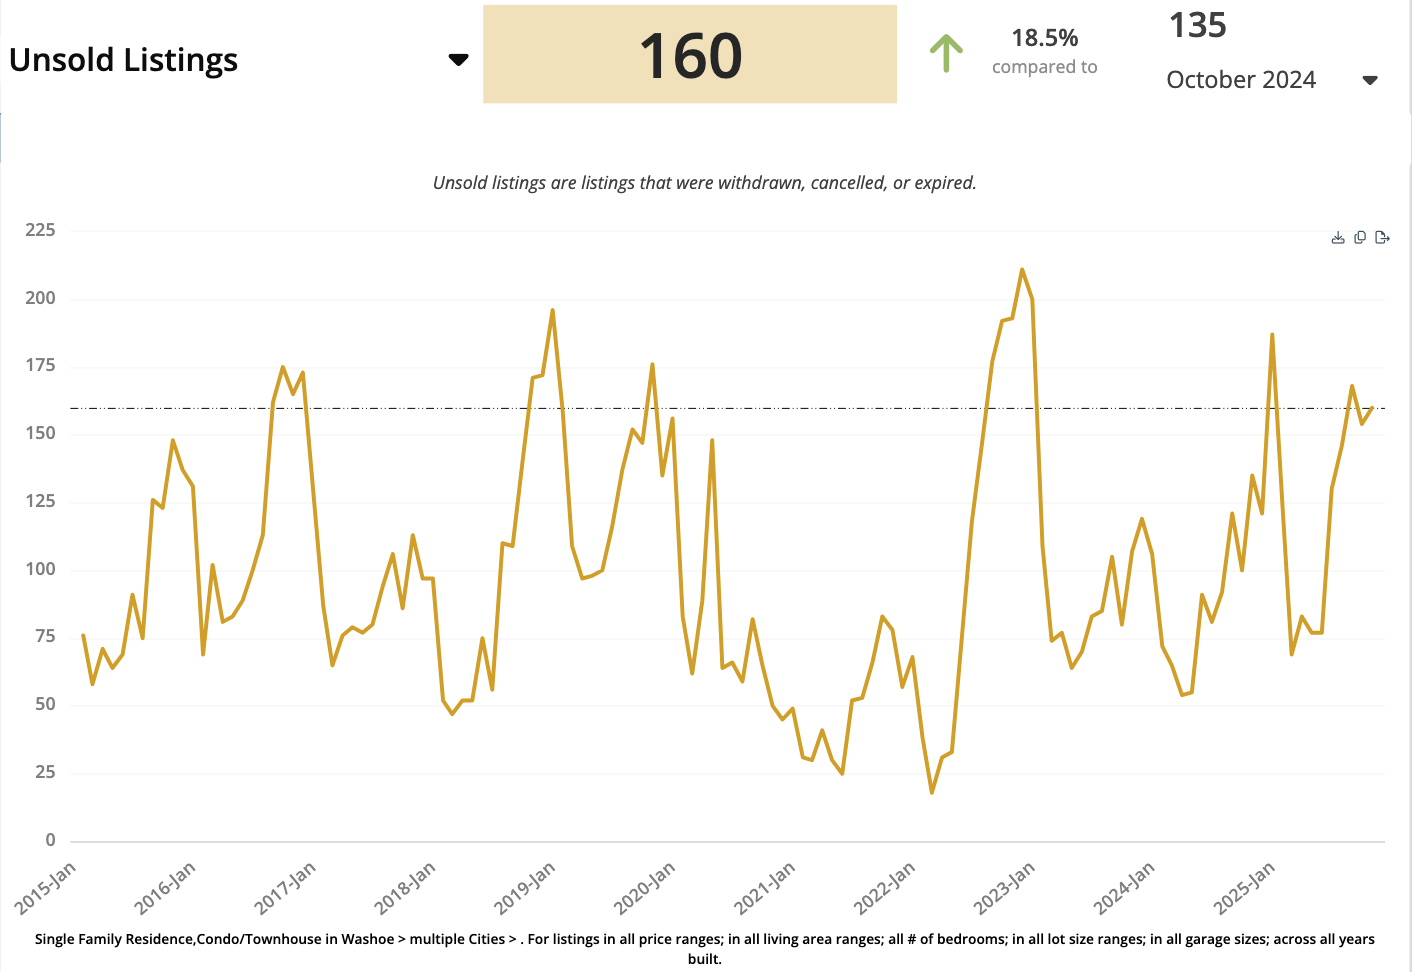
Another early warning sign: 160 listings expired, cancelled, or were withdrawn in October — an 18.5 percent jump from 135 a year ago.
That’s more than 10 percent of all active listings failing to sell.
Overpricing remains the biggest culprit, especially between $600K and $750K, which also overlaps with much of the new-construction market.
🧭 What It Means for Sellers
If your home is on the market — or you’re thinking about listing soon — pricing precision matters more than ever.
We’re heading into the slower season (October through December) when buyer activity naturally dips.
Be realistic, watch competing listings closely, and adjust early rather than late.
🔑 What It Means for Buyers
There’s never a “perfect” time to buy, but late-year markets often bring opportunity.
Less competition, motivated sellers, and steady inventory mean buyers can shop with leverage.
Keep an eye on both resale homes and builder incentives — some excellent values are out there.
📰 Summary Snapshot
| Metric | October 2025 | YoY Change | Interpretation |
|---|---|---|---|
| Mortgage Rate | 6.3% | ↓ 2.8% | Rates easing slightly |
| Median Price | $557,000 | ↑ 0.9% | Stable prices |
| Active Inventory | 1,307 homes | ↓ 6.0% | Fewer listings overall |
| Closed Sales | 494 homes | ↑ 0.4% | Flat but steady |
| Unsold Listings | 160 homes | ↑ 18.5% | More listings expiring |
If you found this useful, share it with a neighbor or friend.
Subscribe to stay ahead of Reno–Sparks housing trends — with new data, charts, and insights each month.
🤝 The Assist2Sell Advantage
Assist2Sell has been helping Reno–Sparks homeowners since 1989, selling thousands of homes the smart, low-fee way.
We’ll sell your home for $4,995 — or 1 percent if over $500,000 — offering full-service marketing, showings, negotiation, and expert representation.
Get a free automated home-value report today and discover how much you could save.
Assist2Sell — Way Smarter.